
Page 13 - EBKSP15
P. 13
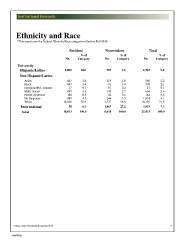
Ethnicity and Race

*This report uses the Federal Ethnicity/Race categories effective Fall 2010.

                                            Resident          Nonresident                Total

                                                        % of                 % of                   % of
                                         No. Category         No. Category           No. Category

University                               2,000    10.6        393 5.9                2,393    9.4
  Hispanic/Latino
                                            447     2.4         119             1.8     566     2.2
  Non Hispanic/Latino                       447     2.4          91             1.4     538     2.1
                                              17    0.1          10             0.2       27    0.1
      Asian                                 485     2.6         179             2.7     664     2.6
      Black                                 102     0.5          42             0.6     144     0.6
      Hawaiian/Pac. Islander                807     4.3         244             3.7   1,051     4.1
      Multi-Racial                       14,458    76.9       3,737            56.5  18,195    71.5
      Native American
      No Response                             50    0.3       1,803            27.2   1,853     7.3
      White
                                         18,813   100.0       6,618           100.0  25,431   100.0
  International

  Total

 Census Date Enrollment for Spring 2015                                                                   9
ebk009bp