
Page 12 - EBKSP15
P. 12
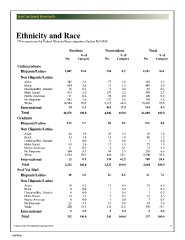
Ethnicity and Race

*This report uses the Federal Ethnicity/Race categories effective Fall 2010.

                                           Resident          Nonresident                 Total

                                                       % of                 % of                    % of
                                        No. Category         No. Category            No. Category

Undergraduate                           1,847    11.4        334 6.9                 2,181    10.4

  Hispanic/Latino                          385     2.4          77              1.6     462     2.2
                                           414     2.6          75              1.5     489     2.3
  Non Hispanic/Latino                        16    0.1                          0.2       25    0.1
                                           413     2.6            9             3.2     570     2.7
       Asian                                 91    0.6         157              0.8     129     0.6
       Black                               581     3.6          38              3.6     754     3.6
       Hawaiian/Pac. Islander           12,384    76.6         173             64.4  15,499    73.8
       Multi-Racial                                          3,115
       Native American                       39    0.2                         17.8     901     4.3
       No Response                                             862
       White                            16,170   100.0                        100.0  21,010   100.0
                                                             4,840
   International
                                        133 5.7              38 2.5                  171 4.4
   Total
                                           44      1.9          25              1.6     69      1.8
Graduate                                   33      1.4          15              1.0     48      1.2
                                                   0.0                          0.0             0.0
  Hispanic/Latino                            1     2.6            0             1.0       1     1.9
                                           60      0.5          15              0.1     75      0.3
  Non Hispanic/Latino                      11      8.7                          3.5     13      6.6
                                          204     78.9            2            29.1    258     59.2
       Asian                            1,854                   54                   2,300
       Black                                       0.5         446             61.2            24.4
       Hawaiian/Pac. Islander              11                                          949
       Multi-Racial                              100.0         938            100.0           100.0
       Native American                  2,351                                        3,884
       No Response                                           1,533
       White
                                        20 6.8               21 8.6                  41 7.6
   International
                                         18 6.2               17 6.9                  35 6.5
   Total                                  0 0.0                1 0.4                   1 0.2
                                          0 0.0                1 0.4                   1 0.2
Prof Vet Med                                                   7 2.9
                                         12 4.1                2 0.8                  19 3.5
  Hispanic/Latino                         0 0.0                                        2 0.4
                                                              17 6.9
  Non Hispanic/Latino                    22 7.5              176 71.8                 39 7.3
                                        220 75.3                                     396 73.7
       Asian                                                   3 1.2
       Black                              0 0.0                                        3 0.6
       Hawaiian/Pac. Islander                                245 100.0
       Multi-Racial                     292 100.0                                    537 100.0
       Native American
       No Response                                                                                                  8
       White

   International

   Total

Census Date Enrollment for Spring 2015

ebk009bp