
Page 7 - EBKSP15
P. 7
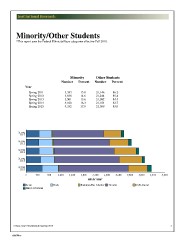
Minority/Other Students

*This report uses the Federal Ethnicity/Race categories effective Fall 2010.

                                         Minority     Other Students

                                         Number Percent Number Percent

Year                                     3,383  13.8  21,146                  86.2
                                         3,636  14.6  21,244                  85.4
   Spring 2011                           3,901  15.6  21,082                  84.4
   Spring 2012                           4,100  16.3  21,104                  83.7
   Spring 2013                           4,332  17.0  21,099                  83.0
   Spring 2014
   Spring 2015

 Census Date Enrollment for Spring 2015                                             3
ebk004cs